
HOW TO PLAY
Earth Estimator
A geography game where knowing the exact answer matters less than understanding the world well enough to make a good estimate.
THE IDEA
What is Earth Estimator?
How well can you estimate a planet?
Earth Estimator is a geography game built around numbers. Instead of asking whether you know a country's capital, flag, or location, the game asks you to estimate things such as its population, land area, median age, GDP, life expectancy, rainfall, coastline length, military spending, and many other statistics.
What is the population of Sweden?
What is the median age of Japan?
What is the land area of Denmark?
You are not expected to know every answer. That is the point.
Earth Estimator is about using what you already know about the world to make a reasonable guess.
You may not know Argentina's cattle population, but you might know that Argentina is large, agricultural, and relatively sparsely populated.
You may not know Norway's exact coastline length, but you already know something about what Norway looks like and how its geography differs from other countries.
The game rewards that kind of reasoning.
Over time, numbers that once felt abstract begin to mean something. Ten million people starts to feel different from one hundred million. A GDP per capita of $20,000 starts to have context. A country covering 50,000 square kilometres starts to feel small next to one covering 2 million.
The goal is not simply to memorize statistics.
The goal is to build an intuition for Earth.
BEFORE PLAYING
The Home Page
2.1
Your Hit Rate
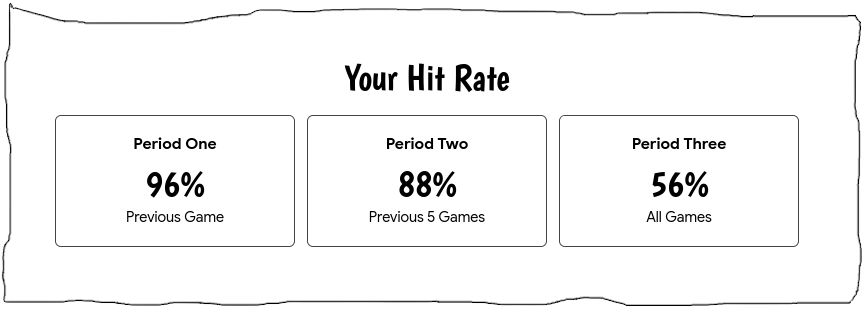
The first major section on the home page shows your Hit Rate.
This gives you a quick overview of how accurate your estimates have been in previous games.
Your final accuracy in the most recent game you played.
Your average accuracy across your five most recent games.
Your average accuracy across every recorded game.
Your most recent result shows how you performed in your last game, while the longer-term averages give you a better idea of whether your geographical intuition is improving.
2.2
Choose What You Want to Play
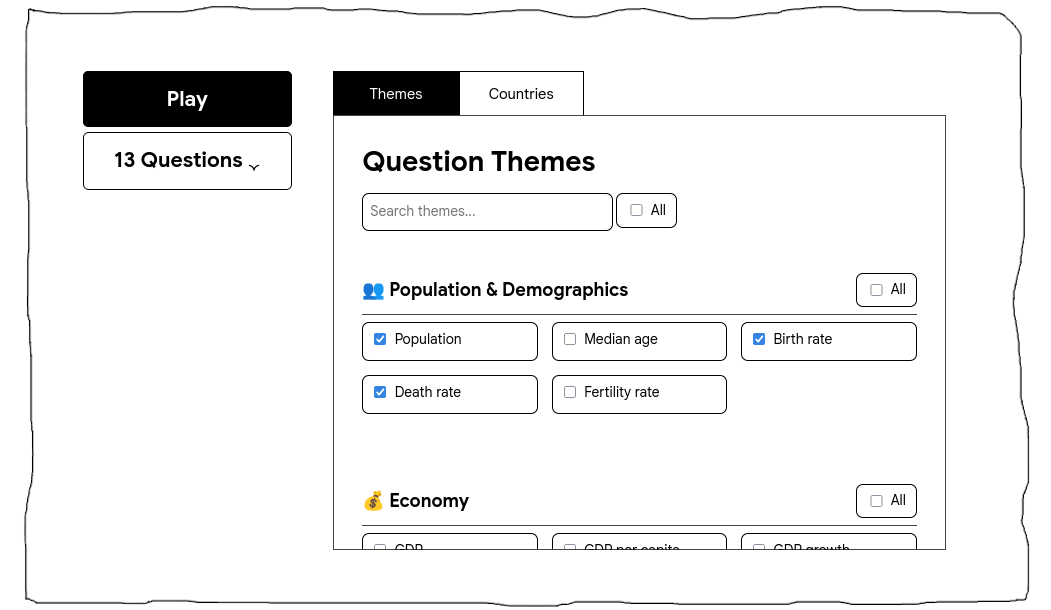
Below your Hit Rate, you choose what kinds of questions can appear in your game.
The selection area is divided into Themes and Countries.
Themes determine what kinds of statistics can appear.
These include subjects such as population, economy, geography, environment, health, education, technology, transport, military, government, and lifestyle.
You can select individual themes or select an entire category at once.
Countries determine which parts of the world your questions can come from.
You can select individual countries, entire continents, or all available countries.
This lets you create either a focused regional game or a completely mixed worldwide game.
You could play only with European economies, African demographics, Asian geography, environmental statistics from around the world, or simply select everything and see what appears.
2.3
Choose the Number of Questions
You also decide how long your next game should be.
Choose one of the preset lengths or enter your own number between 3 and 50 questions.
A shorter game works well for a quick round. A longer game gives you a more reliable final result because your average is based on more estimates.
Once enough themes and countries are selected, the Play button becomes available.
GAMEPLAY
How the Game Works
3.1
Read the Question
After choosing your themes, countries, and number of questions, the game begins.
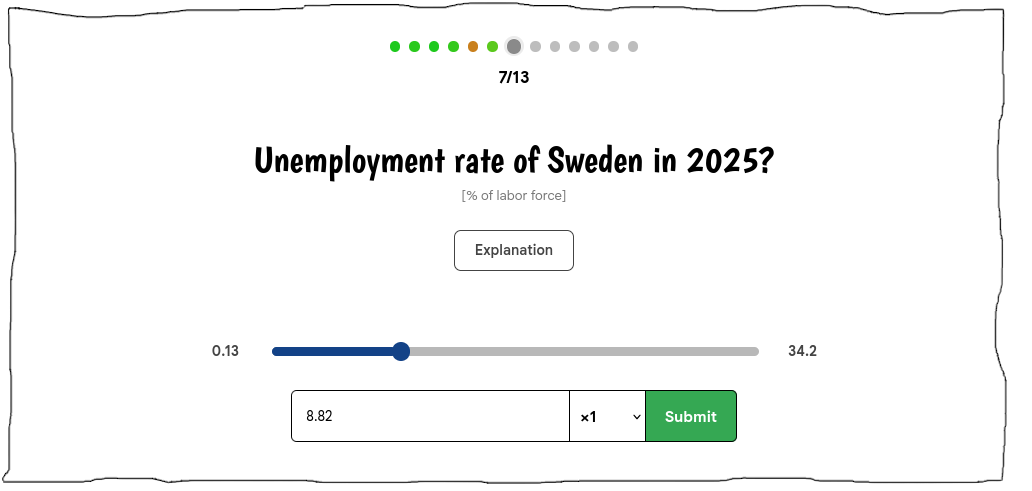
Each round gives you one numerical geography question based on the selections you made on the home page.
The unit shown underneath the question is important. Two statistics can sound similar while measuring completely different things.
If a metric is unfamiliar, open the explanation to see what the statistic and its unit mean.
3.2
Make Your Estimate
Your job is to estimate the correct numerical value.
You can type a number directly into the answer field or use the slider to move through the available range.
For large values, the multiplier makes it easier to work with thousands, millions, and billions.
The slider shows the lowest and highest values available for the metric.
This gives you the boundaries of what is possible without revealing where the correct answer lies.
3.3
Submit Your Answer
Once your answer is valid, the Submit button becomes available.
After submitting, the result screen shows:
- The correct answer
- The unit
- Your accuracy for that question
The result screen continues automatically after a few seconds.
If you want more time to study the result, you can stop the countdown and continue manually.
Suggested image: screenshot of the result screen showing the correct answer and accuracy.
3.4
Follow Your Progress
At the top of the game, every question is represented by a progress dot.
Unanswered
Far away
Getting closer
Highly accurate
By the end of the game, the completed row of dots gives you a quick visual overview of how consistent your estimates were.
3.5
Your Final Result
Every question receives an accuracy score between 0% and 100%.
At the end of the game, all question scores are averaged together to produce your final accuracy.
That final percentage is then added to your Hit Rate history on the home page.
One lucky answer cannot carry the entire game.
A strong result comes from consistently good estimates.SCORING
How Accuracy is Calculated
4.1
Why Not Ordinary Percentage Error?
Earth Estimator does not calculate accuracy using ordinary percentage error.
Ordinary percentage error can make small numbers much more punishing than large numbers.
Earth Estimator instead compares your error with the full available range of the metric.
4.2
Step One: Measure the Error Against the Range
For each metric, the game finds its smallest and largest available values.
The guess is 10 units away from the correct value.
The full range is 100.
The answer is therefore 10% of the full range away from the correct value.
const difference =
    Math.abs(
        playerAnswer - correctValue
    );

const valueRange =
    currentMaximumValue -
    currentMinimumValue;

const rangeError =
    difference /
    valueRange;
This also makes the scoring symmetrical. Being 10 units too low is treated exactly the same as being 10 units too high.
4.3
Step Two: Convert the Error into Accuracy
The range error is then converted into an accuracy score.
Earth Estimator uses a curve instead of a simple linear scale.
Close estimates are rewarded, while guesses that move farther away lose accuracy much faster.
const remainingAccuracy =
    Math.max(
        0,
        1 - (rangeError * 2)
    );

answerAccuracy =
    100 *
    Math.pow(
        remainingAccuracy,
        2
);| Distance from correct answer | Accuracy |
|---|---|
| Exact answer | 100% |
| 5% of range away | 81% |
| 10% away | 64% |
| 20% away | 36% |
| 30% away | 16% |
| 40% away | 4% |
| 50% or more away | 0% |
4.4
Why Use a Curve?
Without the curve, repeatedly guessing around the middle of the available range could produce a reasonable score without much thought.
Imagine every possible answer lies between 0 and 100 and you simply guess 50 every time.
Staying in one safe position may occasionally work, but it is not a reliable strategy.
The system rewards estimation rather than simply playing the middle.
To score well, you need to think about where the answer actually belongs.Suggested image: a graph showing the accuracy curve from an exact answer at 100% down to 0% when the guess is 50% of the range away.
4.5
Final Game Accuracy
After every question, its accuracy score is added to the running total.
totalAccuracy +=
    answerAccuracy;
At the end of the game, the total is divided by the number of questions played.
If you play 10 questions, your final result is simply the average accuracy of those 10 estimates.
That percentage is then stored as the result of the game and becomes part of your Hit Rate history.
ONE LAST THING
There is usually a better guess than “I have no idea.”
Think about the country.
Is it large or small? Rich or poor? Urban or rural? Young or old? Densely populated or sparsely populated?
Is it industrial, agricultural, mountainous, tropical, dry, isolated, or highly developed?
Then compare it with countries you already know.
You may not know the exact answer, but you can often work out what the answer probably isn't.
You do not need to know every number on Earth. You just need to make the best estimate you can.
Start a Game